
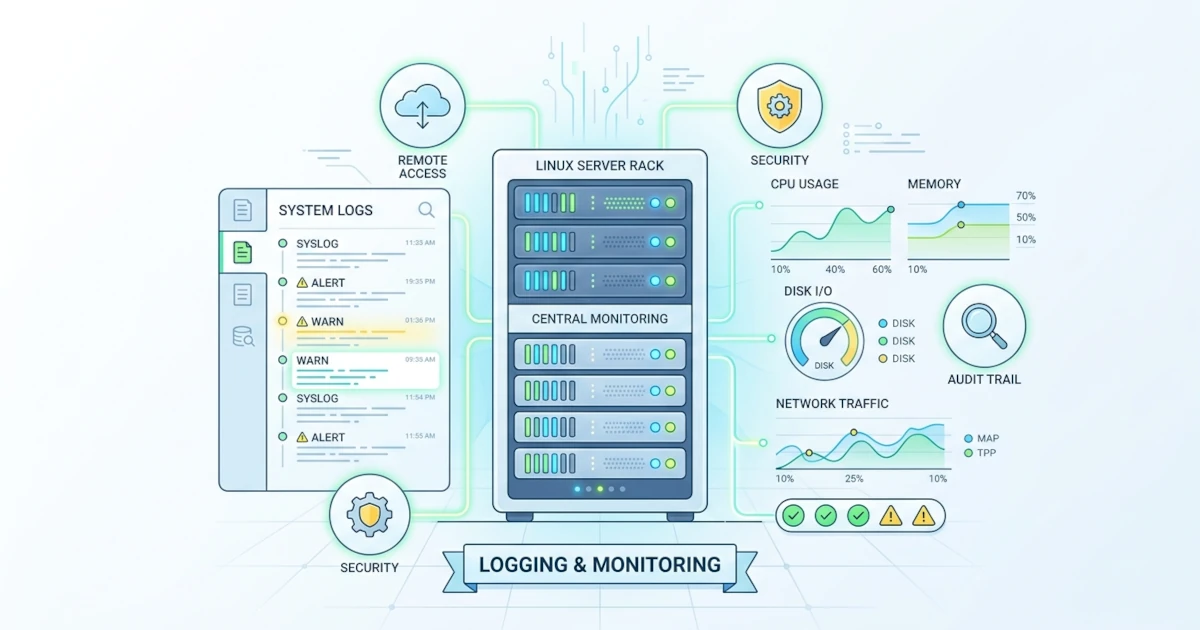
The case study in Chapter 18 concluded with audit-server.sh running automatically via cron or systemd timers without requiring manual execution. However, one important question remains: when a scheduled job runs unattended in the middle of the night, how can you confirm whether it succeeded or pinpoint where it failed? The solution relies on two complementary practices: logging (recording traces of events with timestamps) and monitoring (proactively checking system health against defined thresholds). This chapter covers reading default system logs using journalctl and /var/log, writing custom production-ready logs in scripts, constructing basic monitoring scripts for disks, services, and network connectivity, and combining these elements into a terminal-based server status dashboard. The logging patterns and exit statuses established in this chapter serve as the foundation for Chapter 20, where detected system issues trigger automated notifications via email, Telegram, or Slack.
19.1 Reading and Processing Server Logs
Modern Linux systems feature two primary, complementary log sources: the systemd journal (a structured log database managed by systemd-journald and accessed via journalctl) and traditional text-based logs located in /var/log (used long before systemd became popular). System administrators who understand how to extract information from both sources can diagnose root causes much faster than those who rely on only one.
19.1.1 journalctl: Querying the Systemd Journal
Sections 18.1.4 and 18.3.2 used journalctl -u and -f to verify scheduled jobs. This section explores additional journalctl options useful for daily log investigations.
journalctl -p err -b
journalctl -k
journalctl --since "1 hour ago" --until "now"
journalctl -u nginx.service -n 50 -r
The -p (priority) option filters logs by severity based on the eight standard syslog levels: emerg, alert, crit, err, warning, notice, info, and debug (ordered from most severe to least severe). Specifying a single level, such as -p err, displays messages at that level or higher; therefore, -p err automatically includes crit and alert messages as well. The -b (boot) option limits results to the current boot session (use -b -1 for the previous boot session, which helps investigate unexpected reboots). The -k (kernel) option filters for kernel messages, operating similarly to dmesg while retaining full journalctl filtering capabilities. The --since and --until flags accept flexible time formats as documented in man 7 systemd.time, including relative expressions like "1 hour ago" in addition to absolute dates. The -n 50 flag limits line output similarly to tail, and -r (reverse) displays the newest entries first.
Modern versions of systemd (version 237 and higher, standard across modern distributions) support -g to search for text patterns directly without piping through grep.
journalctl -u nginx.service -g "connection refused"For outputs requiring automated processing by external tools, -o json-pretty formats each log entry as a JSON object containing complete metadata fields (PID, unit, priority, etc.), making it easier to parse programmatically than raw text formats.
journalctl -u nginx.service -o json-pretty -n 1A common issue encounter is unpersisted journal logs. As specified in man 5 journald.conf, the Storage= option defaults to auto, meaning logs persist in /var/log/journal if that directory exists; otherwise, logs are stored temporarily in /run/log/journal and are lost upon system reboot. Several distributions (such as Ubuntu Server and Fedora) create this directory during installation to enable persistence by default, whereas minimal distributions or container images might not. Verify the configuration in /etc/systemd/journald.conf rather than making assumptions. To enable persistent logging manually, create the directory and let systemd-tmpfiles set the correct permissions:
sudo mkdir -p /var/log/journal
sudo systemd-tmpfiles --create --prefix /var/log/journal
Persistent journals require size management to prevent excessive disk usage. Run journalctl --disk-usage to view current disk space usage, and use --vacuum-time=2weeks or --vacuum-size=500M to clear older entries based on time or size limits:
journalctl --disk-usage
sudo journalctl --vacuum-time=2weeks
If journalctl truncates logs and displays a permission hint regarding group access, the current logged-in user is not a member of the systemd-journal group. Run the command with sudo temporarily, or add the user to the group using sudo usermod -aG systemd-journal username (following the usermod -aG pattern from Section 17.3.3) to grant read access without requiring full root privileges.
19.1.2 /var/log and Traditional File-Based Logs
Before systemd-journald was introduced (and alongside it on many active servers), syslog daemons such as rsyslog or syslog-ng wrote logs to plain text files inside /var/log. File names and structures vary by distribution, so avoid assuming uniform file paths across systems.
| File | Distribution | Contents |
|---|---|---|
/var/log/syslog | Debian/Ubuntu (requires rsyslog) | General system logs across multiple services |
/var/log/messages | RHEL/CentOS/Fedora | General system logs (equivalent to syslog) |
/var/log/auth.log | Debian/Ubuntu | Authentication logs: logins, sudo usage, SSH access attempts |
/var/log/secure | RHEL/CentOS/Fedora | Authentication logs (equivalent to auth.log) |
Many modern distributions, particularly minimal images and container environments, omit rsyslog by default and rely exclusively on journalctl, rendering the files above unavailable. Confirm file existence using systemctl status rsyslog or ls /var/log before targeting specific files. Outside of general system logs, application servers write logs to dedicated subdirectories, such as /var/log/nginx/ for the Nginx web server or /var/log/mysql/ for MySQL/MariaDB, following package conventions.
To inspect these files, use the utilities covered in Section 2.3: tail -f to stream new entries in real time, or less +F to stream entries while retaining full scroll capabilities once follow mode is paused via Ctrl+C.
tail -f /var/log/nginx/error.log
less +F /var/log/auth.log
Rotated log files (discussed further in 19.2.4) are commonly compressed as .gz files. Use zgrep and zcat (variants of grep and cat capable of reading gzip archives directly) to inspect compressed log content without manually uncompressing files first.
zgrep "Failed password" /var/log/auth.log.2.gz19.1.3 Filtering and Extracting Logs with grep and awk
grep (Section 9.2) and awk (Chapter 11) serve as primary tools for filtering system logs into relevant information, applicable to both journalctl streams and text files in /var/log.
journalctl -u nginx.service --since today | grep -i "error"Piping journalctl into grep -i narrows down large log streams to entries matching specific keywords regardless of letter case. For traditional syslog formats structured as month day time hostname process[pid]: message, awk can extract specific fields without printing the entire line.
awk '{print $1, $2, $3, $5}' /var/log/auth.log | tail -n 20The command above extracts the month, day, time, and process name (field 5, as field 4 is typically the hostname) from the last 20 lines, truncating long log messages for fast scanning. Combining awk pattern matching with field extraction enables case-insensitive filtering alongside field processing, which cannot be achieved via standard grep -i alone.
awk 'tolower($0) ~ /error|failed/' /var/log/syslog19.2 Writing Custom Script Logs
Automated scripts scheduled via cron or systemd timers (Chapter 18) that fail silently present significant debugging challenges, often remaining unnoticed until secondary issues compound. Implementing structured internal logging within scripts, rather than relying solely on raw echo output, reduces long-term maintenance and troubleshooting overhead.
19.2.1 Log Levels and Message Formats
Effective logging requires two core components: a level indicating severity and a timestamp marking execution time. Four common log levels used in Bash scripting include DEBUG (technical details for troubleshooting), INFO (normal operational events, such as "backup started"), WARN (anomalous conditions that do not halt execution), and ERROR (critical task failure). Maintaining a single-line string format simplifies future parsing via grep.
[2026-08-31 02:00:01] [INFO] Backup started
[2026-08-31 02:00:45] [WARN] Backup size larger than average
[2026-08-31 02:01:02] [ERROR] Failed to copy to target server
19.2.2 Reusable Logging Functions
Writing inline printf statements with repeated timestamps across scripts can result in inconsistent formatting over time. Encapsulating log logic within a dedicated function (following Section 8 patterns) standardizes formatting and allows central modifications when required.
LOG_FILE="/var/log/daily-backup/backup.log"

log() {
    local level="$1"
    shift
    local message="$*"
    local timestamp
    timestamp=$(date '+%Y-%m-%d %H:%M:%S')
    printf '[%s] [%s] %s\n' "$timestamp" "$level" "$message" >> "$LOG_FILE"
    if [[ "$level" == "ERROR" ]]; then
        printf '[%s] [%s] %s\n' "$timestamp" "$level" "$message" >&2
    fi
}

log INFO "Backup started"
log ERROR "Failed to copy to target server"
The shift command on line 2 (Section 12.1) drops the first argument (level), consolidating remaining arguments into the "$*" string variable. This permits calls like log INFO "Backup started" without requiring explicit string quoting for multi-word parameters. Messages evaluated at the ERROR level are output to two destinations: appended to the file via >> (Section 5.3) and written to stderr via >&2. This ensures immediate feedback during interactive execution while persisting entries during automated execution via cron. Ensure the target directory for LOG_FILE exists and possesses correct permissions for the executing user (via mkdir -p and chown from Section 17.3.2); otherwise, logging operations fail silently if directory access is revoked.
19.2.3 Sending Logs to Syslog/Journal with logger
An alternative to maintaining isolated log files is forwarding messages directly to syslog/journal using logger, a standard utility included in util-linux across Linux distributions. This integrates script logging directly into centralized logging pipelines without requiring custom file handling or rotation routines.
logger -t daily-backup "Backup started"
logger -p local0.warning -t daily-backup "Backup size larger than average"
The -t (tag) flag tags the message source for simple filtering, while -p sets the facility.priority string based on the standard syslog schema described in Section 19.1.1. Log messages emitted via logger appear directly inside journalctl and can be queried using the specified tag:
journalctl -t daily-backupSelecting between isolated log files and logger depends on operational requirements: isolated files suit long structured reports (such as audit-server.sh output from Section 17.4), whereas logger suits short event-driven messages designed to aggregate alongside system unit logs in the journal.
19.2.4 Log Rotation with logrotate
Custom log files created via the log() function in Section 19.2.2 grow continuously if unmanaged, potentially consuming available disk space as described in Section 17.1.3. The logrotate utility, pre-installed on standard Linux distributions, automates log lifecycle management using configuration files placed in /etc/logrotate.d/.
sudo nano /etc/logrotate.d/daily-backup/var/log/daily-backup/backup.log {
weekly
rotate 4
compress
missingok
notifempty
create 0640 root root
}The weekly directive defines rotation frequency, rotate 4 keeps four historical log archives before purging the oldest file, compress compresses rotated logs into .gz format (readable via zgrep per Section 19.1.2), missingok prevents execution errors if the source log file is missing, notifempty skips rotation for zero-byte files, and create 0640 root root initializes the new log file with explicit permissions and ownership using standard file permissions (Section 17.3.2). Note that logrotate does not run as a continuous background daemon; instead, it is triggered periodically via cron.daily or the systemd timer logrotate.timer, matching the scheduling mechanisms detailed in Chapter 18.
Validate new rotation rules using -d (debug mode, which simulates rotation without modifying files) or -f (force mode, which executes immediate rotation):
sudo logrotate -d /etc/logrotate.d/daily-backup
sudo logrotate -f /etc/logrotate.d/daily-backup
19.3 Basic Monitoring Scripts: Disk, Service, and Connectivity Checks
While logging records historical events, monitoring actively checks system state against predefined operational parameters. This section establishes three distinct utility checks before integrating them into a consolidated dashboard in Section 19.4.
19.3.1 Disk Space Monitoring with Thresholds
This implementation streamlines the cek_disk approach from Section 17.4.2 to target a single root filesystem.
PERCENT=$(df -h / --output=pcent | tail -n 1 | tr -d ' %')
if (( PERCENT >= 80 )); then
    echo "WARNING: root filesystem usage is at $PERCENT%"
fi
Using tr -d ' %' (Section 9.4) strips spaces and percentage symbols from the df --output=pcent output, isolating integer values for evaluation within arithmetic evaluation blocks (( )). For multi-filesystem monitoring, the while read loop structure from Section 17.4.2 remains the recommended pattern.
19.3.2 Service Status Checks with systemctl
The systemctl binary provides three query subcommands designed for programmatic evaluation within conditional statements without needing complex output parsing of systemctl status: is-active, is-enabled, and is-failed. These subcommands output a brief status string to stdout and return an exit status of 0 when conditions match, making them suitable for direct use in if statements.
if systemctl is-active --quiet nginx; then
    echo "nginx is active"
else
    echo "WARNING: nginx is not active"
fi
The --quiet flag suppresses standard text output, isolating the command's exit status code. These read-only query commands do not require root privileges, unlike administrative commands (start, stop, restart) described in Section 18.3.2. Note that service unit names vary across Linux distributions; for instance, the SSH service is named ssh on Debian/Ubuntu systems, but sshd on RHEL/Fedora/Arch systems. Ensure target unit names match the target environment.
19.3.3 Network Connectivity Checks with ping
Basic status dashboards require verifying whether remote network hosts are reachable before diagnosing specific service-level endpoint failures.
if ping -c 1 -W 2 8.8.8.8 &> /dev/null; then
    echo "Connectivity OK"
else
    echo "WARNING: no response from host"
fi
The -c 1 option restricts output to a single ICMP echo packet, while -W 2 enforces a two-second response deadline before returning a non-zero failure code. Standard output and standard error are suppressed via redirection to /dev/null using &> (Section 5.3). Note that argument units for -W differ across operating system implementations: Linux iputils ping uses seconds, while macOS/BSD implementations use milliseconds. Advanced networking utilities, including curl for HTTP/API endpoint verification and ss for active socket inspection, are detailed in Chapter 22; this section uses basic ping functionality for simple status checks.
19.4 Case Study: Terminal-Based Server Status Dashboard
This final case study integrates the log() function from Section 19.2.2 with the checks from Section 19.3 to form a script named dashboard-server.sh. The script provides a high-level overview of system health and refreshes dynamically at configured intervals.
19.4.1 Dashboard Design
The script parses four command-line flags via getopts using the structural pattern defined in Section 12.2.3: -i sets the refresh interval in seconds (defaulting to 5), -s accepts a space-delimited string of service unit names, -H defines the network ping target, and -o sets the output log file path. Detected anomalies (such as high disk usage, stopped services, or network timeouts) trigger the log() function at the WARN level, preserving historic records across interface refreshes. Execution terminates cleanly upon receiving a Ctrl+C signal via a trap directive; advanced signal handling and cleanup procedures are detailed in Section 25.2.
19.4.2 Script Implementation
#!/bin/bash

INTERVAL=5
LOG_FILE="dashboard-server.log"
SERVICES=("ssh" "cron")
HOST="8.8.8.8"

usage() {
    printf 'Usage: %s [-i interval] [-s "svc1 svc2"] [-H host] [-o log_file]\n' "$0" >&2
    exit 1
}

while getopts ":i:s:H:o:h" opt; do
    case "$opt" in
        i) INTERVAL="$OPTARG" ;;
        s) read -ra SERVICES <<< "$OPTARG" ;;
        H) HOST="$OPTARG" ;;
        o) LOG_FILE="$OPTARG" ;;
        h) usage ;;
        :) echo "Error: option -$OPTARG requires an argument" >&2; exit 1 ;;
        \?) echo "Error: unknown option: -$OPTARG" >&2; exit 1 ;;
    esac
done

log() {
    local level="$1"
    shift
    local timestamp
    timestamp=$(date '+%Y-%m-%d %H:%M:%S')
    printf '[%s] [%s] %s\n' "$timestamp" "$level" "$*" >> "$LOG_FILE"
}

cek_disk() {
    local percent
    percent=$(df -h / --output=pcent | tail -n 1 | tr -d ' %')
    printf '=== Disk (/) ===\n'
    if (( percent >= 80 )); then
        printf '[WARNING] root filesystem %s%%\n' "$percent"
        log WARN "Root disk usage at $percent%"
    else
        printf '[OK]      root filesystem %s%%\n' "$percent"
    fi
}

cek_service() {
    printf '\n=== Service Status ===\n'
    local svc
    for svc in "${SERVICES[@]}"; do
        if systemctl is-active --quiet "$svc"; then
            printf '[OK]      %s active\n' "$svc"
        else
            printf '[WARNING] %s inactive\n' "$svc"
            log WARN "Service $svc is inactive"
        fi
    done
}

cek_koneksi() {
    printf '\n=== Connection to %s ===\n' "$HOST"
    if ping -c 1 -W 2 "$HOST" &> /dev/null; then
        printf '[OK]      host %s responding\n' "$HOST"
    else
        printf '[WARNING] host %s not responding\n' "$HOST"
        log WARN "Host $HOST not responding to ping"
    fi
}

trap 'printf "\nDashboard stopped.\n"; exit 0' INT

while true; do
    clear
    printf 'Server Status Dashboard - %s\n' "$(date '+%Y-%m-%d %H:%M:%S')"
    printf -- '----------------------------------------\n'
    cek_disk
    cek_service
    cek_koneksi
    printf '\nRefreshing every %s seconds. Press Ctrl+C to exit.\n' "$INTERVAL"
    sleep "$INTERVAL"
done
The -s flag processes input using read -ra SERVICES <<< "$OPTARG", leveraging a here-string (<<<) to pass a string into standard input without external pipes. Combined with the -a array assignment flag in read, the space-delimited string populates elements into the SERVICES array (Section 4.1), overriding the default ("ssh" "cron") array assignment. The default target list uses the ssh service name (standard on Debian/Ubuntu systems as noted in 19.3.2); override this via -s "sshd cron" on RHEL/Fedora environments. The final operational loop uses a while true construct (Section 7.2) combined with clear and sleep to refresh the terminal display.
19.4.3 Verification and Scheduling
Assign execution permissions to the script and run it using default settings to verify functionality.
chmod +x dashboard-server.sh
./dashboard-server.sh
Test failure scenarios directly by temporarily stopping a target service (remember to restart the service after testing) or passing an unreachable test IP address to verify that [WARNING] output renders correctly during operational failures.
./dashboard-server.sh -H 203.0.113.1 -i 3
tail -f dashboard-server.log
The IP address 203.0.113.1 belongs to the documentation IP subnets defined in RFC 5737 (192.0.2.0/24, 198.51.100.0/24, and 203.0.113.0/24), providing safe testing targets that do not disrupt external production infrastructure. Running tail -f dashboard-server.log in a separate terminal session confirms that warnings displayed on the dashboard UI are appended to the log file via the log() function.
Interactive terminal dashboards provide real-time visibility during active maintenance operations (such as deployments in Chapter 21), but they are not intended for continuous unmonitored execution. The health checking logic (cek_disk, cek_service, cek_koneksi) and logging routines can be separated from the visual display loop and scheduled via cron or systemd timers, matching the design of audit-server.sh from Section 18.4. Chapter 20 builds on this architecture, demonstrating how WARN log entries can trigger automated alerts sent directly to email, Telegram, or Slack endpoints.