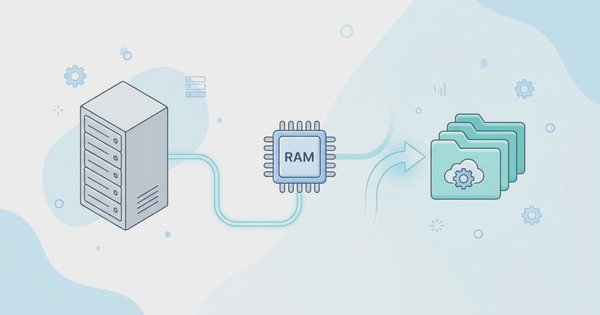

A heavy server monitoring stack often becomes a dedicated issue for sysadmins managing small VPS instances or micro servers. Prometheus combined with Grafana is indeed powerful, but it requires significant RAM and CPU just to monitor servers with limited resources. At this point, Beszel emerges as a lightweight, modern, and practical server monitoring solution that can be deployed within minutes.
Why Server Monitoring Needs to Be Lightweight
Sysadmins managing a few small VPS instances usually face a classic dilemma: they want full visibility into CPU, RAM, disk, and containers, but do not want the monitoring tool itself to consume more resources than the applications being monitored. Prometheus with its time-series database, coupled with Grafana as a dashboard, is a solid combination for enterprise scale. However, for one or two VPS instances with 1 to 2 GB of RAM, this stack feels overkill.
Beszel takes a different approach. It is built so that its memory and CPU footprint is much smaller than conventional solutions, while still providing features needed by sysadmins daily: real-time Docker container statistics, historical data, and an alerting system. Because of its simple architecture, we can run Beszel on small servers without sacrificing resources that should be dedicated to the main application.
What is Beszel
Beszel is a lightweight server monitoring platform that includes Docker statistics, historical data, and alert functionality. This open-source tool features a user-friendly web interface, simple configuration, and is ready for use immediately after installation. Beszel supports automated backups, multi-user management, OAuth authentication, and API access for custom integrations.
This tool is best suited for sysadmins, DevOps engineers, and self-hosting enthusiasts who need fast visibility into server health without building a complex monitoring stack. Developers managing several VPS instances for personal projects or small teams will also find it beneficial because there is no need to learn query languages like PromQL just to view CPU charts.
Key Features of Beszel
Besides being lightweight, Beszel brings several features that make it a worthy candidate to replace heavier monitoring stacks.
Real-Time Docker Statistics
Beszel tracks CPU, memory, and network usage for each container historically. Sysadmins can immediately identify resource-heavy containers without having to inspect docker stats manually one by one.
Alerting and Notifications
The Beszel alert system can be configured for CPU, memory, disk, bandwidth, temperature, fan speed, load average, and system status. These notifications are delivered via Shoutrrr, a Go library supporting over 20 notification channels, including Discord, Telegram, Slack, Gotify, Pushover, and generic webhooks.
Multi-User and OAuth
Each user can manage their own systems, while administrators can grant access to specific systems to other users. Beszel supports OAuth/OIDC authentication from over 20 public providers such as Google, GitHub, and Microsoft, along with support for self-hosted providers like Authelia, authentik, Keycloak, and Zitadel.
Automatic Backup and API
Historical data and configurations can be backed up to local disk or S3-compatible storage. Beszel also provides API access for custom integration needs, such as fetching metric data into external systems.
Beszel Hub and Agent Architecture
Beszel uses a two-component model: Hub and Agent. This separation allows Beszel to remain lightweight even when monitoring multiple servers simultaneously.
Beszel Hub
Beszel Hub is a web application built on top of PocketBase, acting as a central data collection server as well as providing the web interface (UI). All dashboards, historical charts, and alert settings are managed from this Hub.
Beszel Agent
Beszel Agent is a lightweight service installed on each target server being monitored. The Agent is responsible for collecting local system metrics and forwarding them to the Hub for visualization.
Hub and Agent Communication
The Hub and Agent can communicate via two modes: SSH or WebSocket. In SSH mode, the connection is initiated by the Hub connecting to the Agent SSH server on port 45876 by default. This mode is suitable when the Hub can reach the Agent, but the Agent cannot reach the Hub, such as when the Hub resides in a private network. Upon initial execution, the Hub generates an ED25519 key, and the Agent-side SSH server only accepts connections with this key. The SSH server does not provide a pseudo-terminal or accept input, so even if the private key is leaked, an attacker still cannot execute commands on the Agent. In WebSocket mode, the Agent initiates the connection to the Hub URL. Beszel uses a two-way authentication handshake: the Agent sends a registration token via HTTP headers, the Hub proves its identity by signing the token using its private key, and the Agent responds with a unique fingerprint locking its registration to the host machine. The choice of these two modes makes sense because server network topologies vary, allowing Beszel to provide flexibility based on firewall configurations.
Installing Beszel Hub and Agent
This section guides us through installing Beszel from scratch: running the Hub, connecting the Agent to a target server, and monitoring Docker statistics.
Installation Prerequisites
Before starting, make sure the server has:
- An updated Linux server (Ubuntu, Debian, or CentOS).
- Docker and Docker Compose installed.
rootaccess or a user withsudoprivileges to run containers.
Get €25 Free Credit UpCloud
Claim €25 BonusDeploying Beszel Hub
The Hub is the first component that needs to be deployed because the Agent requires the Hub URL to connect.
- Create a working directory for the Hub:
mkdir beszel && cd beszel - Create a
docker-compose.ymlfile with the following contents:
Replace theservices: beszel: image: henrygd/beszel:latest container_name: beszel restart: unless-stopped environment: APP_URL: http://IP-atau-domain-hub:8090 ports: - 8090:8090 volumes: - ./beszel_data:/beszel_dataAPP_URLvalue with the address used to access the Hub, such as your domain or public server IP. - Run the Hub using Docker Compose:
docker compose up -d - Open
http://your-hub-ip-or-domain:8090in a browser, then create the initial admin account when prompted.
Connecting Servers with the Agent
Once the Hub is active, the next step is connecting the target servers to be monitored. The Agent can be run as a Docker container or directly as a native binary without Docker, depending on what best fits the target server environment.
- In the Hub UI, click the Add System button in the top-right corner.
- Enter the target server address, and the Hub will generate a unique
TOKENandKEYfor that Agent. Since version 0.12.0, you can also use a universal token from the/settings/tokensmenu to avoid generating a new token each time you add a server.
Deploying the Agent with Docker
- On the target server, create a working directory for the Agent:
mkdir beszel-agent && cd beszel-agent - Create a
docker-compose.ymlfile containing the Agent configuration:
Replaceservices: beszel-agent: image: henrygd/beszel-agent:latest container_name: beszel-agent restart: unless-stopped network_mode: host volumes: - ./beszel_agent_data:/var/lib/beszel-agent environment: LISTEN: 45876 HUB_URL: http://IP-atau-domain-hub:8090 TOKEN: <token-dari-add-system> KEY: "<key-dari-add-system>"TOKENandKEYwith the values obtained from the Add System dialog in the previous step. - Run the Agent:
docker compose up -d
The network_mode: host configuration above is not merely a preference, but a requirement. The Agent requires direct access to the host network interface to read network statistics, and host mode automatically exposes all container ports to the host, including port 45876 for SSH. If the Hub is on a different network and needs to reach the Agent via SSH mode, ensure port 45876 is open on the target server firewall. Shortly after the Agent starts running, the server status on the Hub dashboard will change to online and metric graphs will begin populating.
Deploying the Agent as a Binary
If the target server is not running Docker, or if the sysadmin prefers running the Agent as a native service, Beszel provides an official binary installation script for Linux and FreeBSD. This script is written in Go, compiling into a single binary executable without external dependencies.
- Download and run the installation script on the target server:
This script requirescurl -sL https://get.beszel.dev -o /tmp/install-agent.sh && chmod +x /tmp/install-agent.sh && /tmp/install-agent.shrootprivileges to create a dedicated user namedbeszeland register the Agent as a systemd service so it remains active after rebooting. The Agent process itself runs under thebeszeluser, notroot. - If you want to bypass interactive prompts, pass the
KEY,TOKEN, and Hub URL directly via flags:/tmp/install-agent.sh -k "<key-from-add-system>" -t <token-from-add-system> -url http://your-hub-ip-or-domain:8090 - Follow the prompts to enable or disable daily automatic updates, after which the script will immediately start the Agent and register it as a service.
Other useful flags include: -p to change the listening port (default 45876), -v to specify a version, --auto-update to configure automatic updates via flags instead of interactive prompts, and -u to uninstall. Run /tmp/install-agent.sh -h to view the full list of options.
Monitoring Docker Statistics
Connecting the Agent to Docker varies depending on the chosen deployment method. If the Agent is installed as a binary on the same server running Docker, the Agent can directly read /var/run/docker.sock on the host without mount configurations, provided the beszel user created by the script has access permissions for the socket. A common practice on Linux to grant this access is adding the user to the docker group via sudo usermod -aG docker beszel, but check your server security policies first as docker group membership is equivalent to root access.
If the Agent is deployed via Docker Compose, you need to explicitly mount the Docker socket into the Agent container. Add the following volume line to the Agent docker-compose.yml file:
    volumes:
      - ./beszel_agent_data:/var/lib/beszel-agent
      - /var/run/docker.sock:/var/run/docker.sock:ro
Mount docker.sock with the :ro (read-only) flag so the Agent can only read container statistics without controlling them. After adding this line, restart the Agent using docker compose up -d to apply changes. The Hub dashboard will then display CPU, memory, and network usage for each container in real-time along with historical data.
Beszel Production Configuration
The basic installation is sufficient to start monitoring servers, but several additional settings should be enabled before using Beszel in a production environment.
Enabling OAuth
Password-based login alone is less than ideal for multi-user teams. Beszel supports OAuth/OIDC through the following steps:
- Open Hub settings, then temporarily disable the "Hide collection create and edit controls" switch.
- Navigate to the
userscollection to edit it. - On the "Options" tab, enable OAuth2 and add your chosen providers, such as Google, GitHub, or self-hosted providers like Keycloak.
- Re-enable the collection protection switch disabled in the first step.
Use the redirect URL <hub-url>/api/oauth2-redirect when registering your OAuth application with the provider. To force all users to authenticate via OAuth only, set the environment variable DISABLE_PASSWORD_AUTH=true in the Hub container.
Alert and Notification Setup
Alerts are enabled per system through the systems table on the Hub dashboard, while notification channels are configured in the Settings > Notifications menu using the Shoutrrr URL format. For example, Discord notifications use discord://token@id, while Telegram uses telegram://token@telegram?chats=channel. Once the notification URL is saved, simply set CPU, RAM, disk, or other metric thresholds directly from each server detail page.
Backup Strategy
Because the Hub is built on PocketBase, historical data and configurations can be automatically backed up to local storage or S3-compatible storage. Sysadmins should schedule regular backups, especially when retaining long-term historical data, ensuring user configurations, Agent tokens, and alert history are preserved if Docker volume issues occur.
Beszel vs Netdata vs Grafana and Prometheus
All three tools serve server monitoring, but target different needs.
| Aspect | Beszel | Netdata | Grafana + Prometheus |
|---|---|---|---|
| Setup Complexity | Very simple, Hub and Agent run directly via Docker Compose | Simple, one agent per host with many built-in collectors | More complex, requires configuring scrape targets, data sources, and separate dashboards |
| Primary Focus | Host and Docker container metrics, basic alerting | Super detailed real-time metrics with thousands of collectors | Versatile observability platform for metrics, logs, and large-scale tracing |
| Ideal Scale | 1 to dozens of small VPS/servers | Single host up to medium scale | Enterprise-scale infrastructure with multiple services |
| Learning Curve | Low | Low to medium | Medium to high, requires understanding PromQL |
Sysadmins managing small personal VPS instances or client servers will benefit more from Beszel due to its quick setup and resource efficiency. Conversely, engineering teams managing dozens to hundreds of services with deep observability needs, including complex metric queries and tracing, will remain better served by Grafana and Prometheus.
Conclusion
Beszel proves that server monitoring does not have to be complex or resource-heavy. Its lightweight Hub-Agent architecture, real-time Docker statistics, flexible alerting via Shoutrrr, and multi-user OAuth authentication make this tool a sensible choice for sysadmins and self-hosting enthusiasts managing small to medium VPS environments. If you are starting to build a monitoring infrastructure and do not yet need the complexity of Prometheus and Grafana, try deploying Beszel on your first server and add new Agents as your monitoring needs grow.